

Want to visualize waste and areas for improvement by man-hours

If it takes a lot of time and effort to analyze and visualize, it is difficult to make continuous improvements.
TimeTracker is more than just a man-hour/project-management tool. It aims to help improve operations.
Highly accurate man-hours,Analysis and quick visualization without troubleBecause you can, anyone can start improving today.
Quick visualization of areas for improvement
-
I can easily see how I work
Have you ever thought, "I'm busy, but... I don't know why I'm busy?
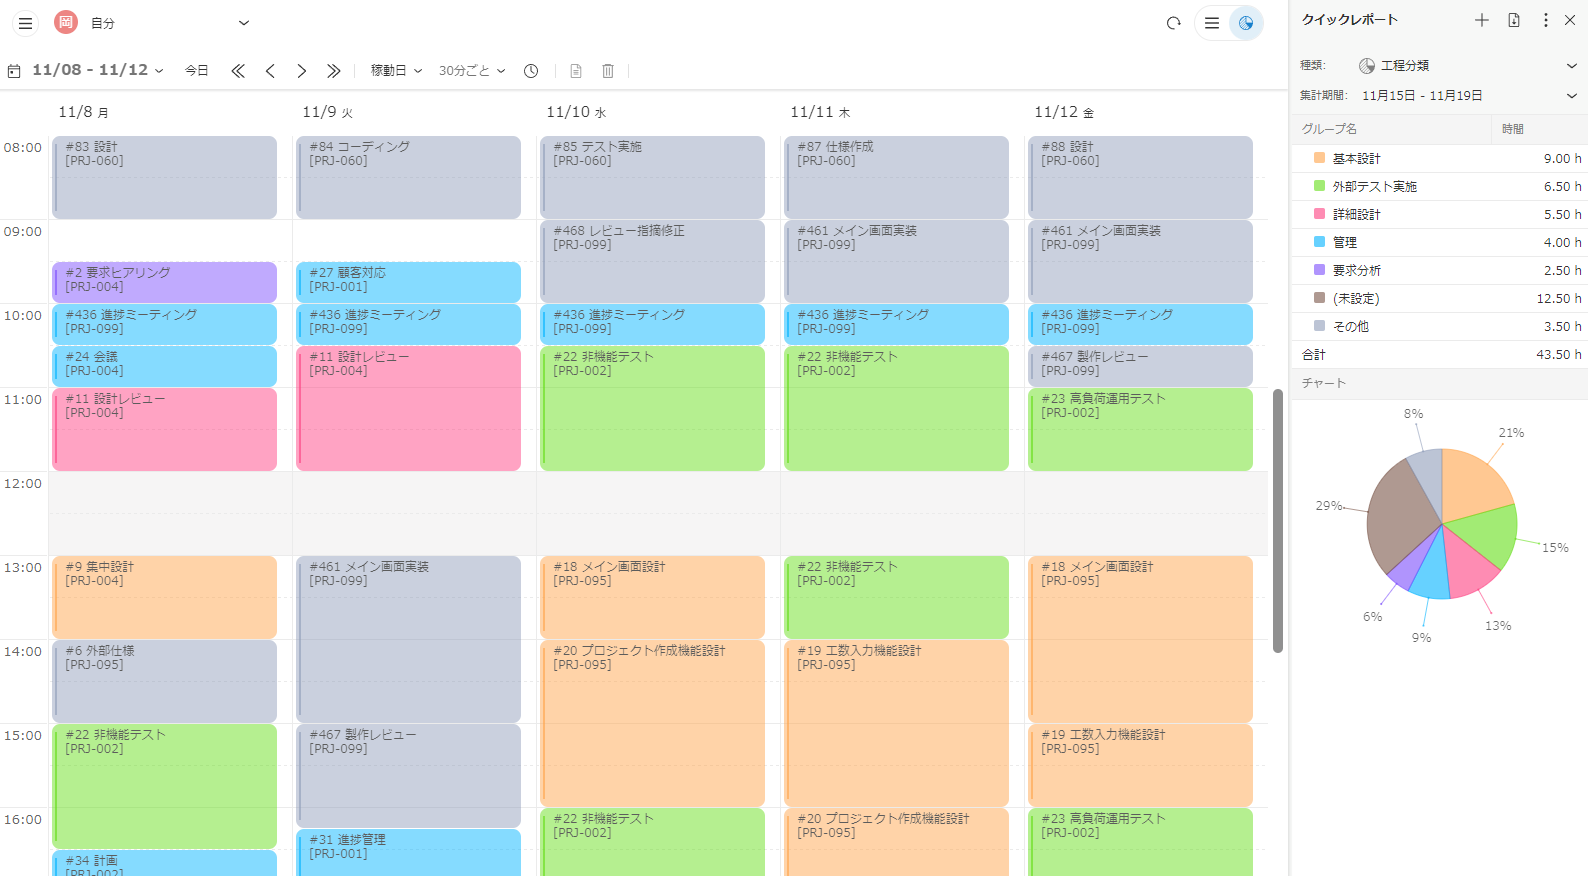
In such a case, use the man-hours you have collected to check your work performance. It's not what I thought it would be and it's not true.
For TimeTracker man-hoursQuick visualization with numerical values and graphsYou can start checking your work today.
You may find out things you didn't even realize you had. -
Always know how to use project man-hours
Can you quickly estimate how much time is spent
on management and reviews, how that compares with the past, and what the current trend is? TimeTracker continuously charts work-time ratios by project process and the time
spent on rework, allowing teams to take improvement action immediately. -
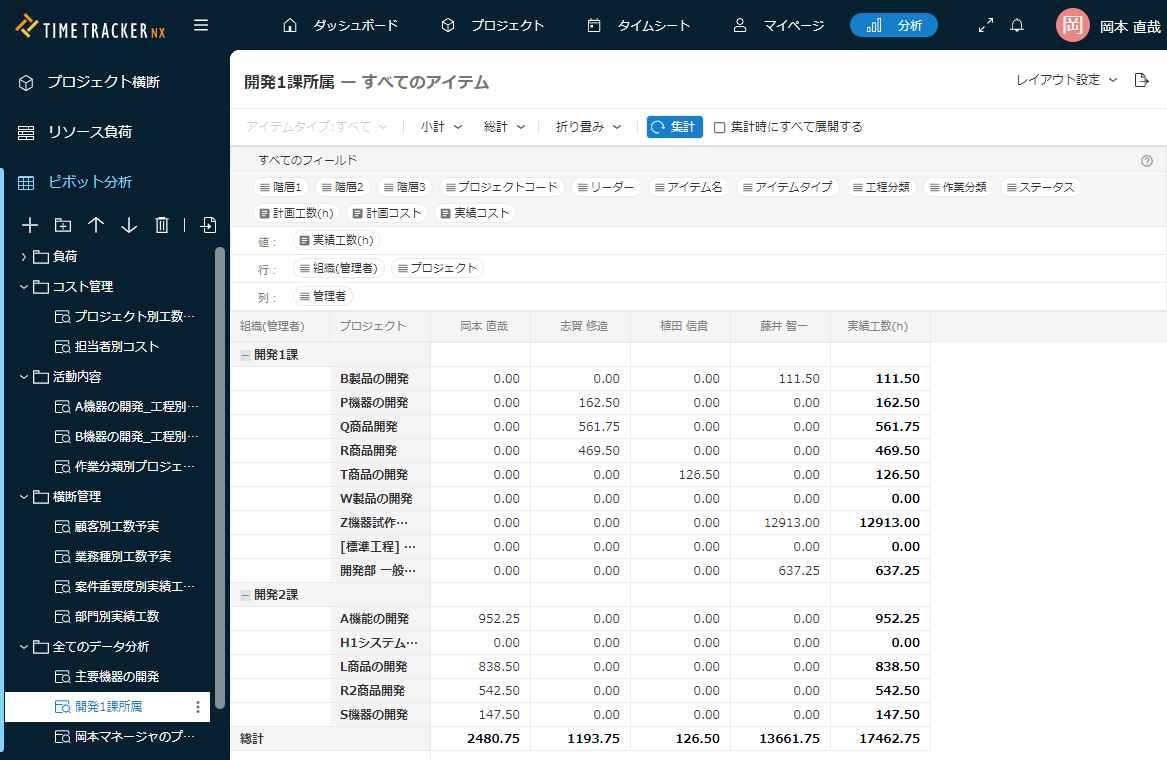
Ready to analyze in tissue and Cross-project
Collected data cannot support improvement if
analysis is too difficult. TimeTracker aggregates
work-time data flexibly and analyzes it immediately
across organizations, projects, and members. Built-in charts eliminate the need to export the data to Excel for every analysis.
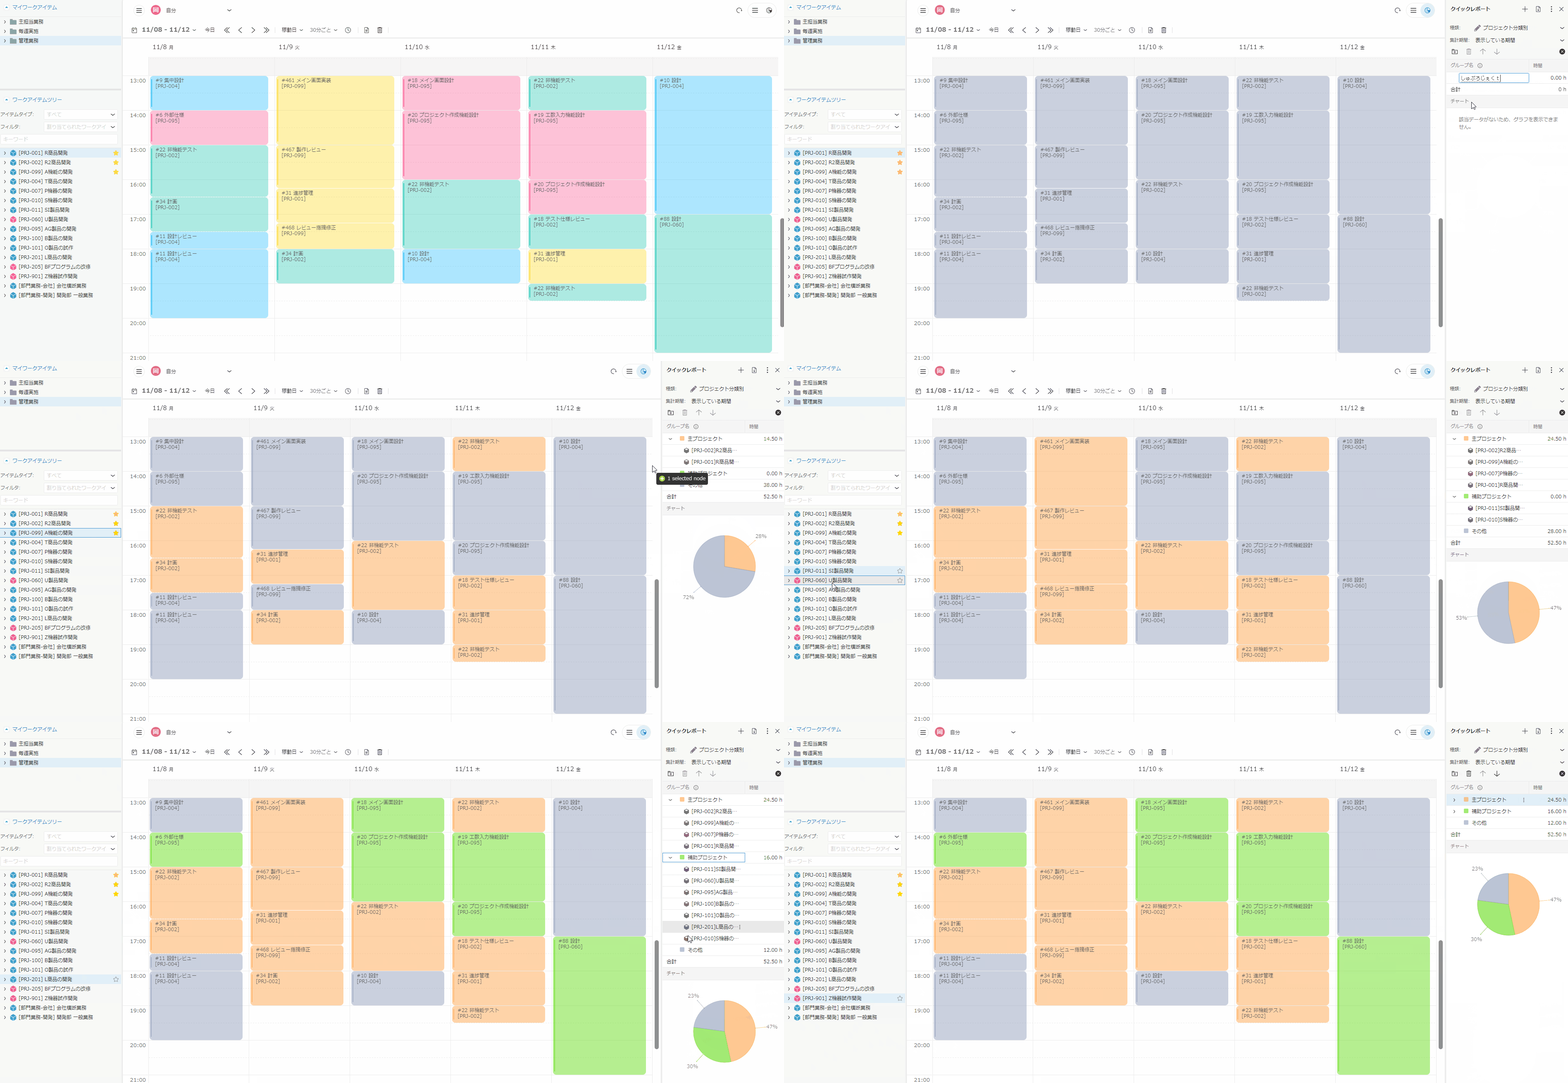
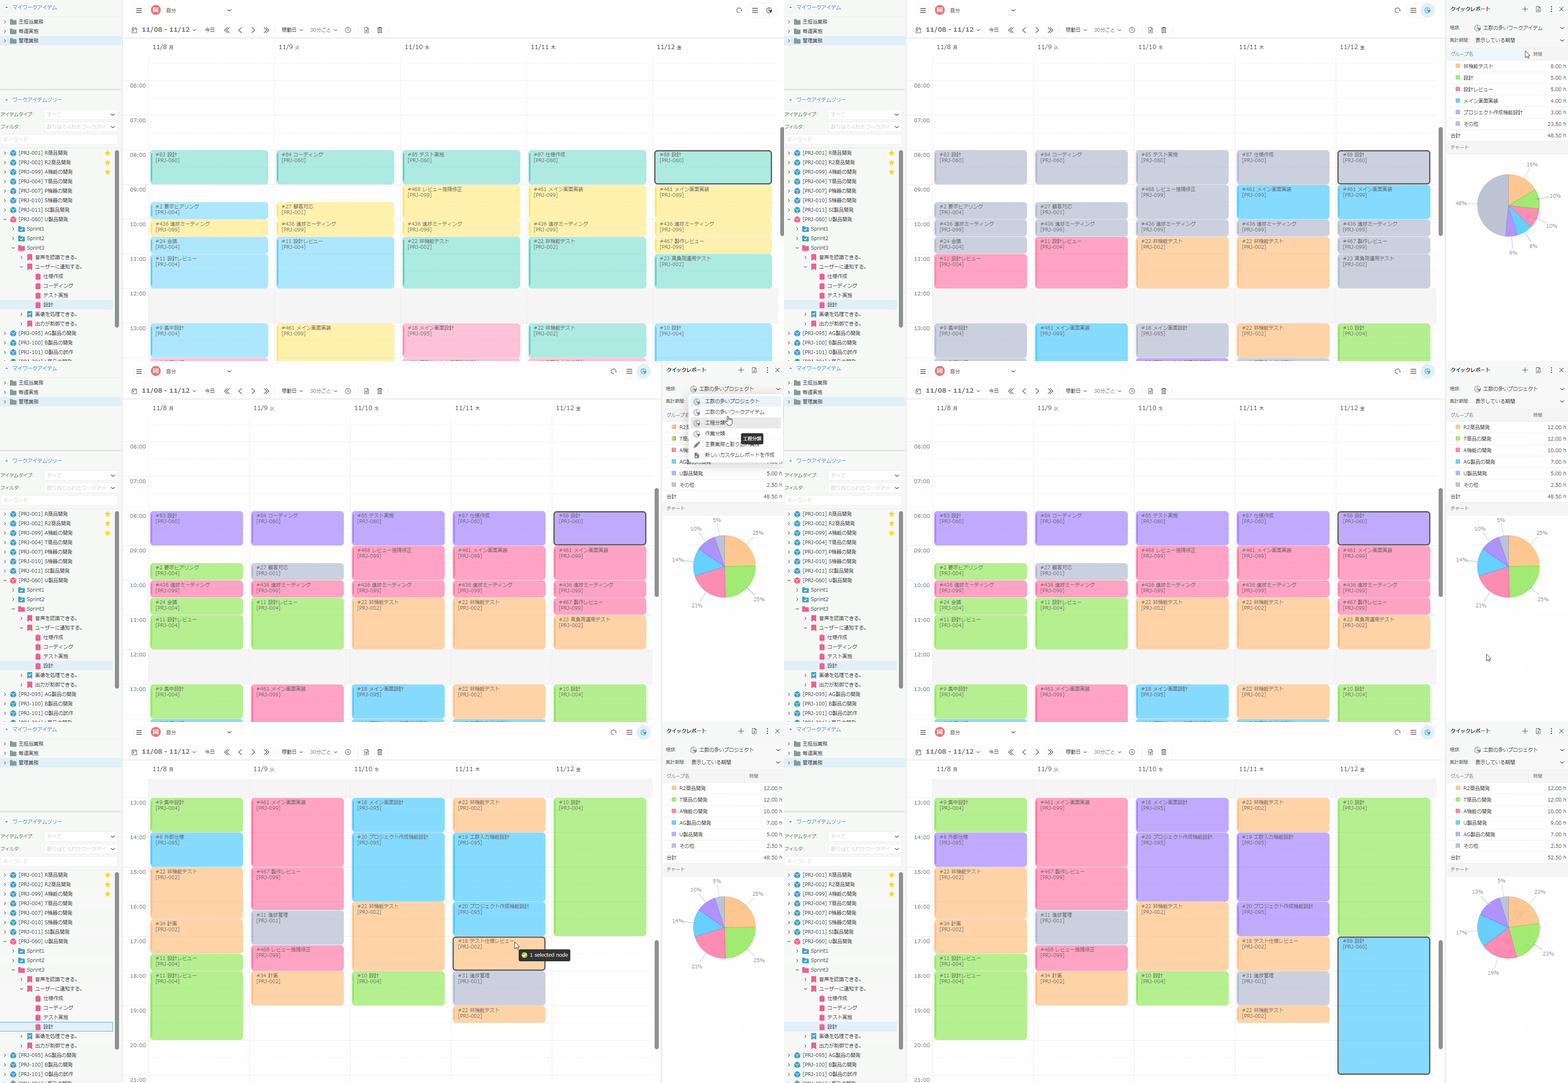
Examples of visualization
-
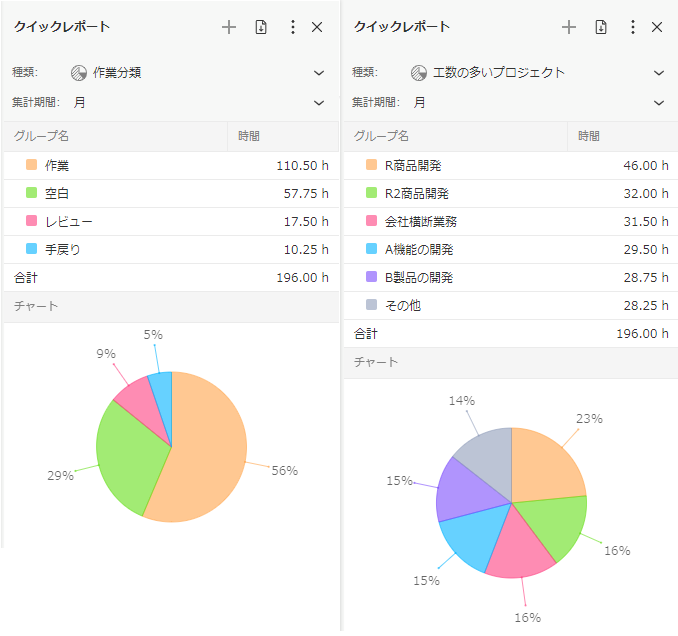
Visualization of the quality of one's work
Can you evaluate work quality quantitatively? TimeTracker reveals quality as well as work volume. Grouping actual work time into work, review, and rework provides insight
into quality. If rework time is high, teams can
revise their procedures and measure results such as
a reduction in rework compared with the previous month. -
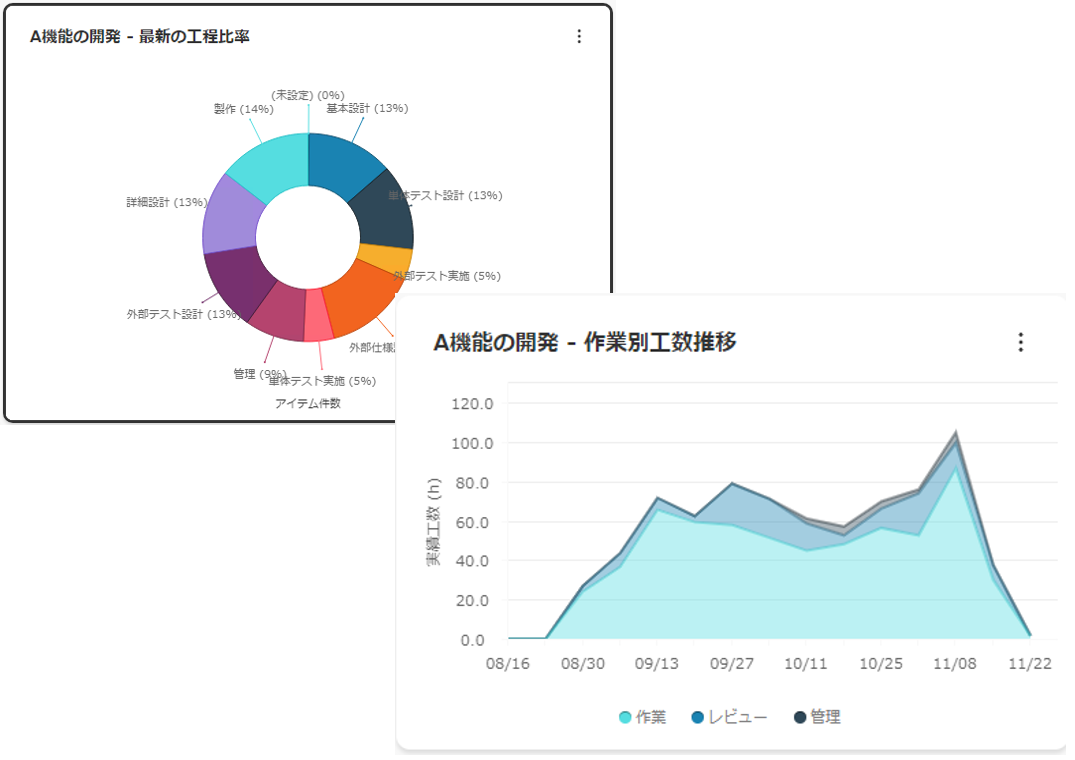
Visualization of the man-hours for each process of a project
Use work-time ratios by process to
improve project estimates and operations. Historical
results can inform the next estimate, while
ratios from an active project reveal its health. Accumulating facts such as the percentage of total time spent on
management and reviews enables evidence-based project management. -
Visualization of wasteful meetings and variations in man-hour input
Do you know immediately which projects and processes members are spending their time on?
If you look at the man-hours by organization, project, and process, you can see variations and waste. There may be cases where the meeting time is too much or the man-hours are not being used.
Immediate analysis and visualizationTo deal with the current problem.