


Visualizing data quickly
TimeTracker RX supports day-to-day visibility from individual
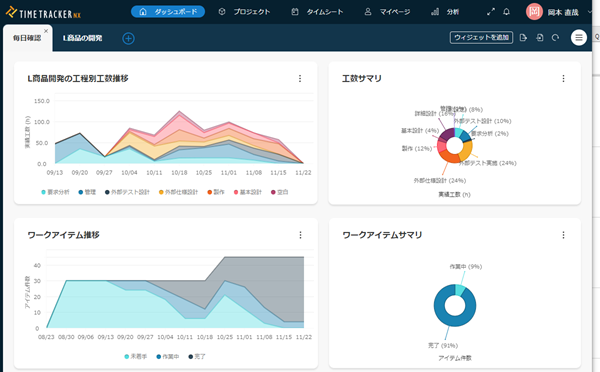
work through tasks and projects. Dashboards make it easy to check work-time data and the latest project information, while Quick Reports visualize data immediately as time is entered. You can also drill down by any WBS level
to analyze work time and task completion.
Fast, effortless visibility helps teams improve their work.
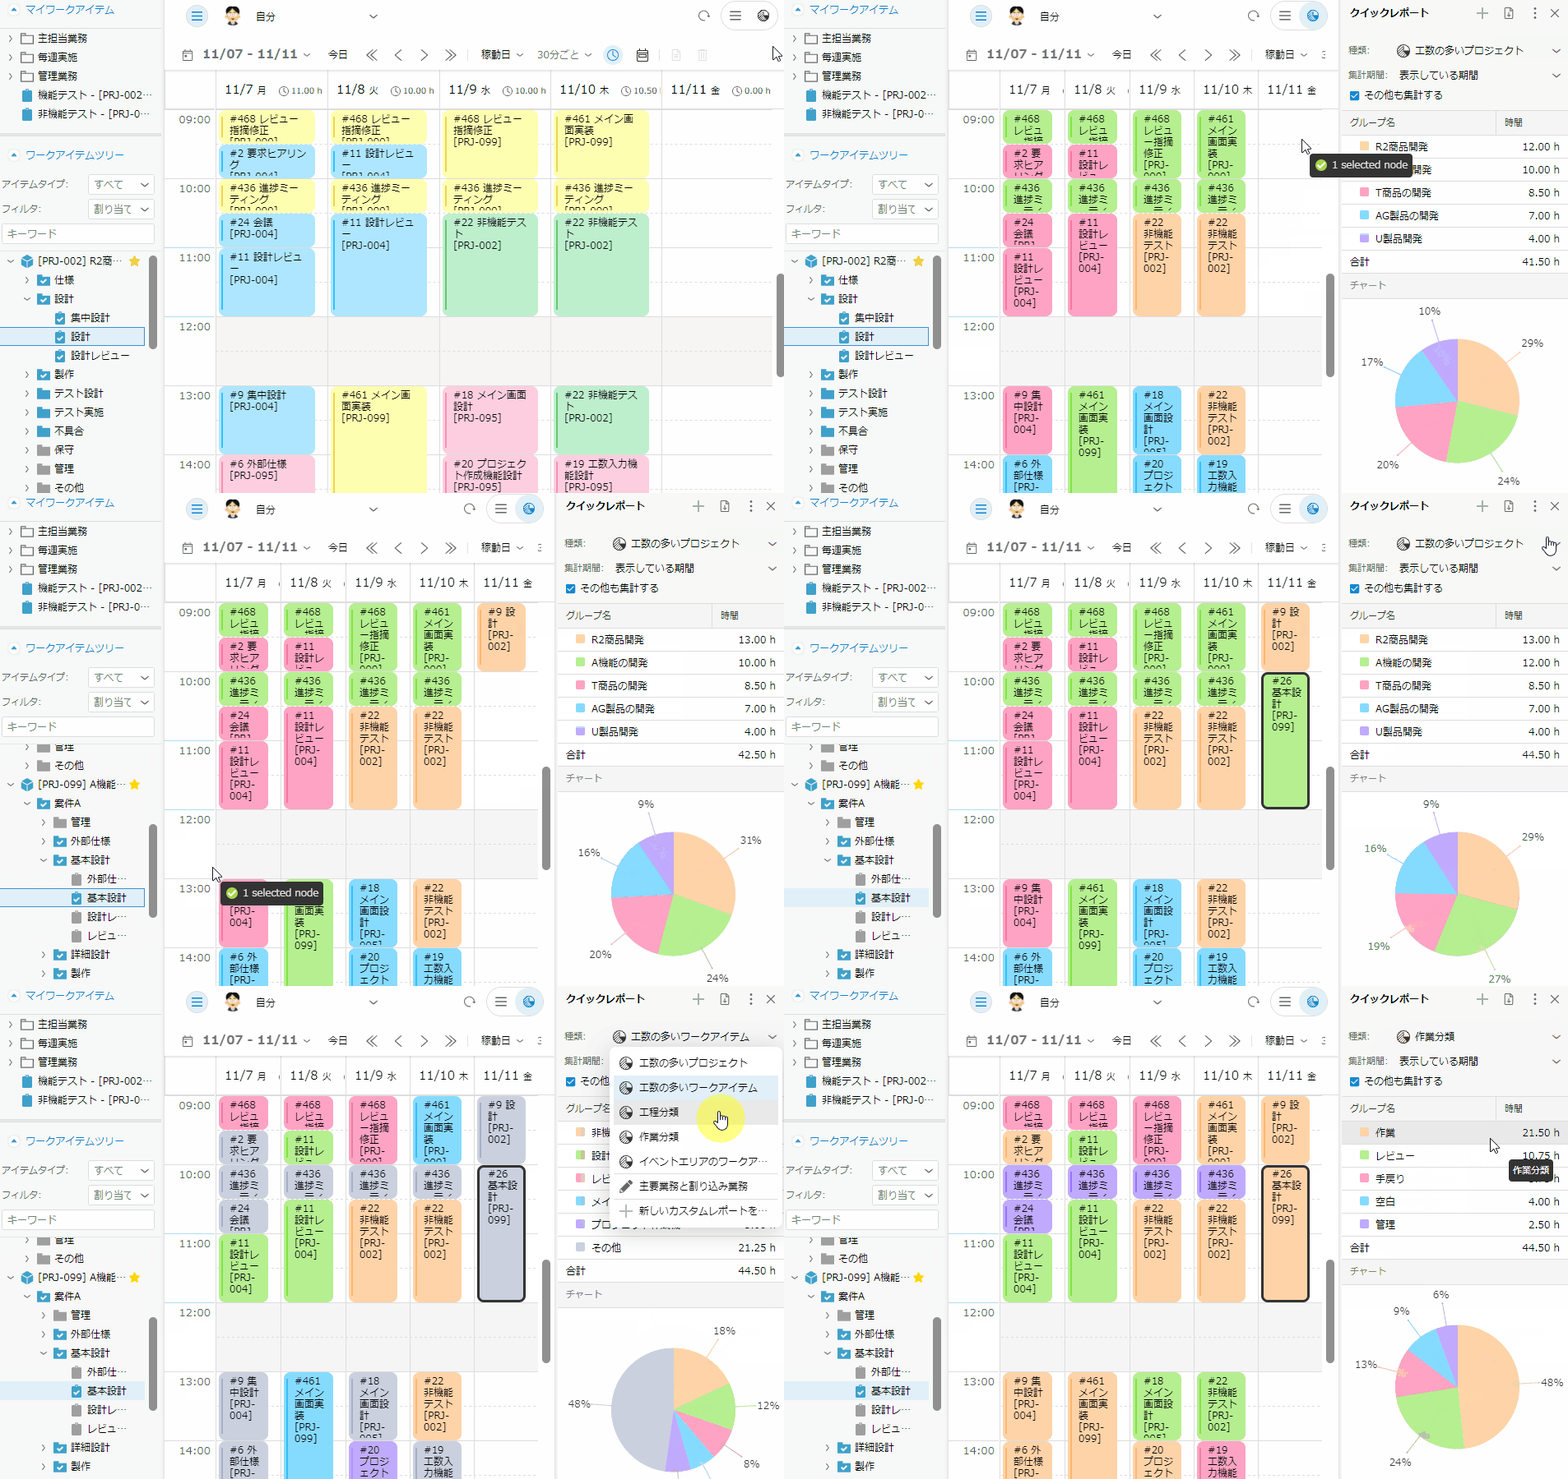
Looking back while entering the man-hours
Entered actual time is aggregated immediately. Quick
Report automatically charts it so users can review
their work time at once. Because activity colors
match chart colors, users can easily recognize patterns
such as interruptions pushing core work into the
evening, reports accumulating until the weekend, or whether
they spent enough time on the week's priorities.
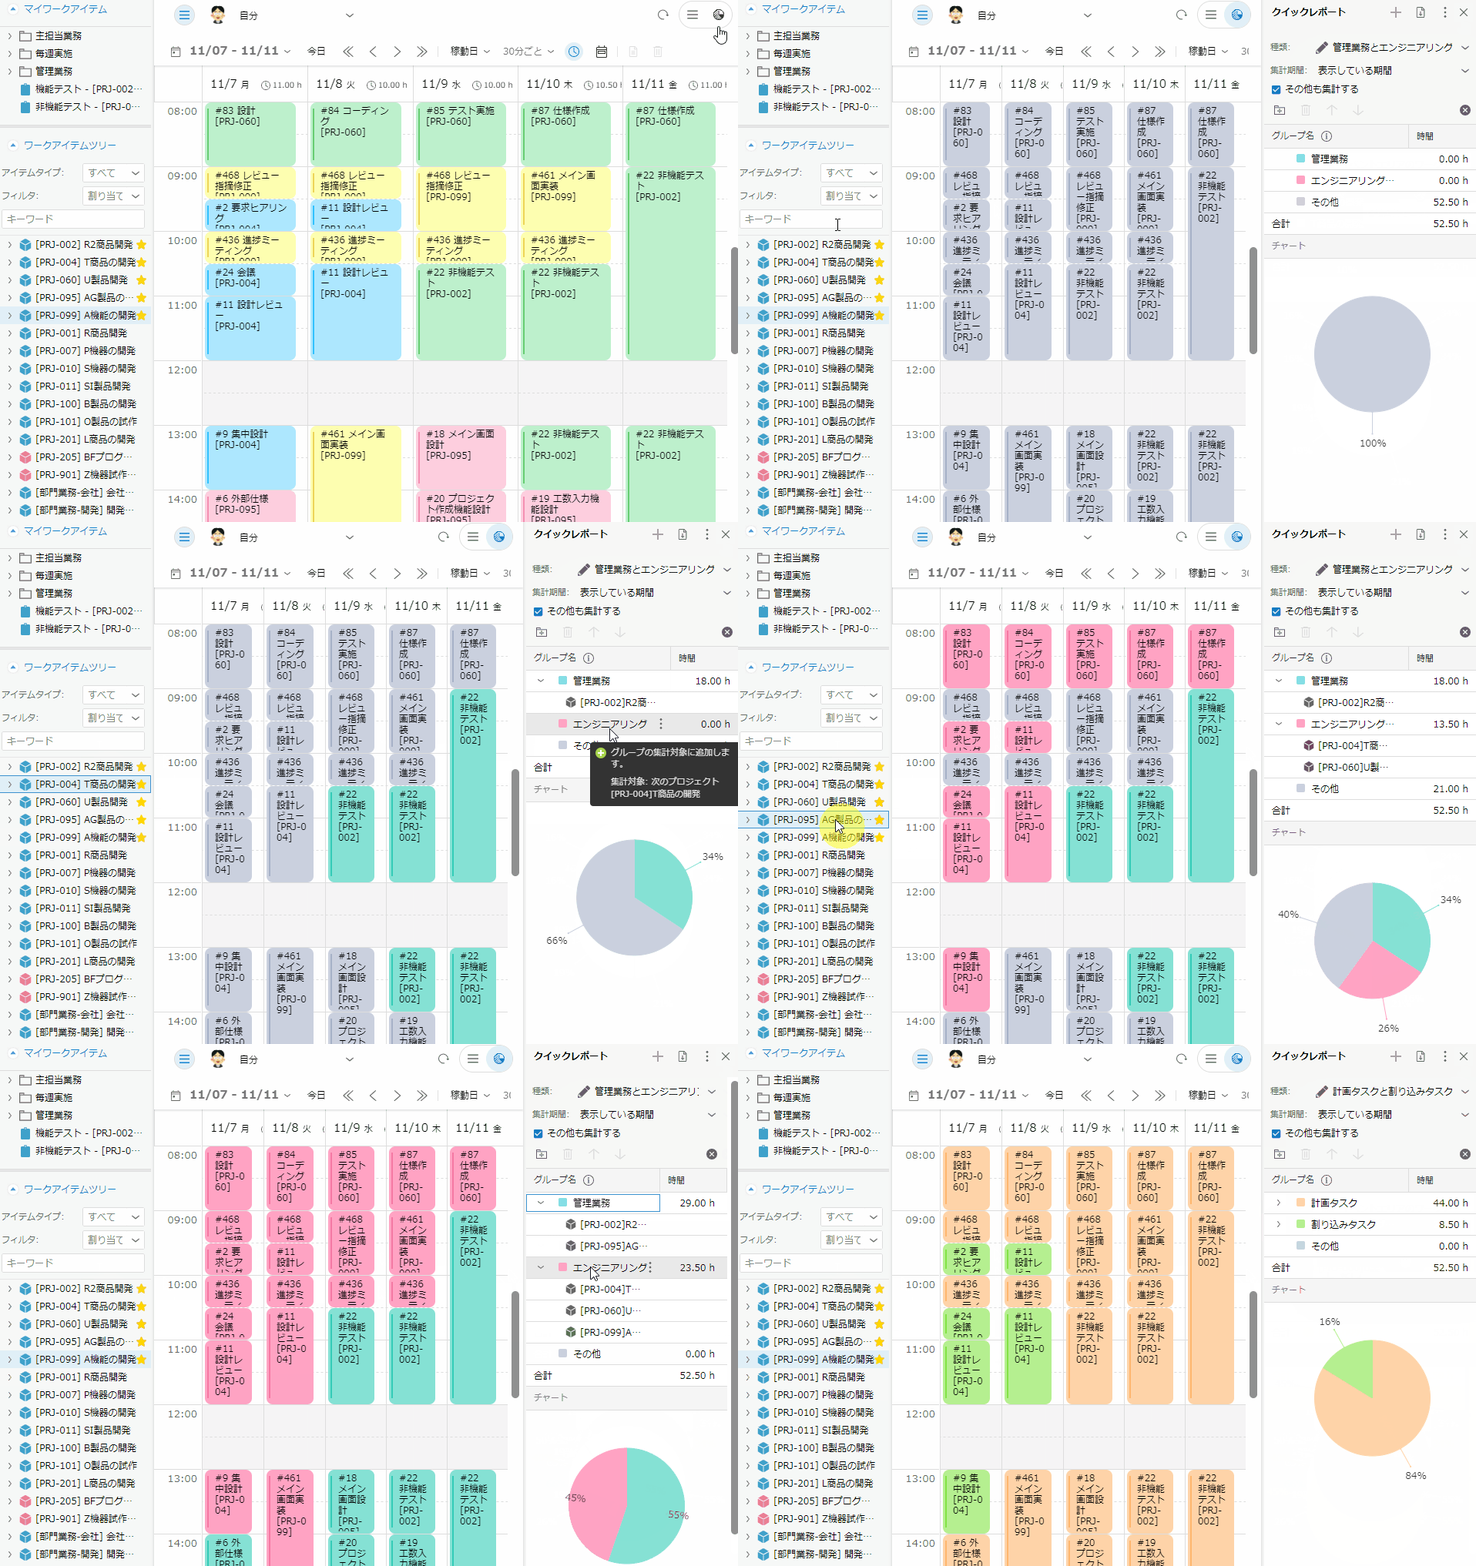
Time entry analysis immediately from a point of view you care about
In a quick report in addition to the fixed unit aggregation of "per project" and "per process"Immediately analyze man-hours from a worrying point of viewYou can.
The following flexible conditions can be set and visualized, which leads to the discovery of issues.
・Data is roughly divided into "administrative work" and "engineering work"
・Aggregation divided into "Planning task" and "Interrupt task"
Summarizing Project Efforts
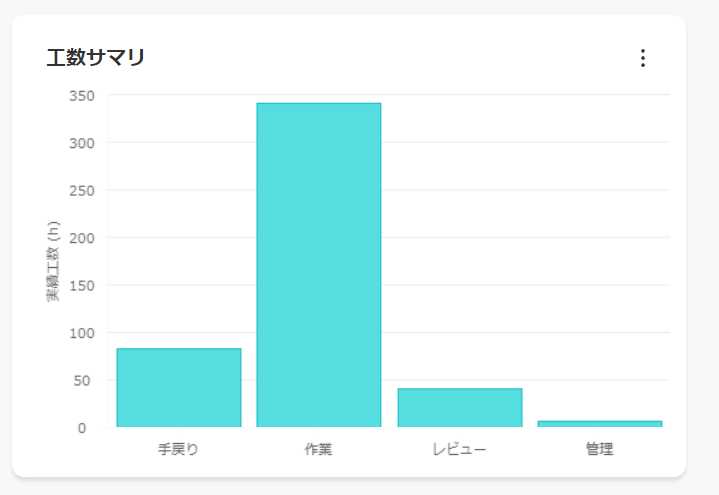
Project man-hours can be visualized from various perspectives.
You can summarize and check the breakdown of the project effort as follows:
・"review" and "return" work types
・By process
・By member
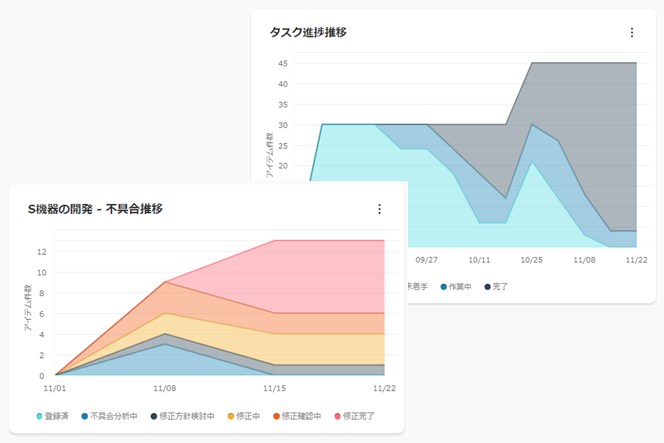
Visualization of task digestion status and defect convergence status
It is useful to visualize the progress of a task from the viewpoint of digestion status.
If the number of completed tasks increases on a daily basis and the number of tasks that have not been started or are being worked on decreases on a daily basis, it can be said that the project is proceeding smoothly.
On the other hand, if the number of completed tasks remains flat, it is a danger signal.
Check the graph to see when the defect will converge. Various project items are visualized in real time.
-
With man-hours and project updates
Easy check every day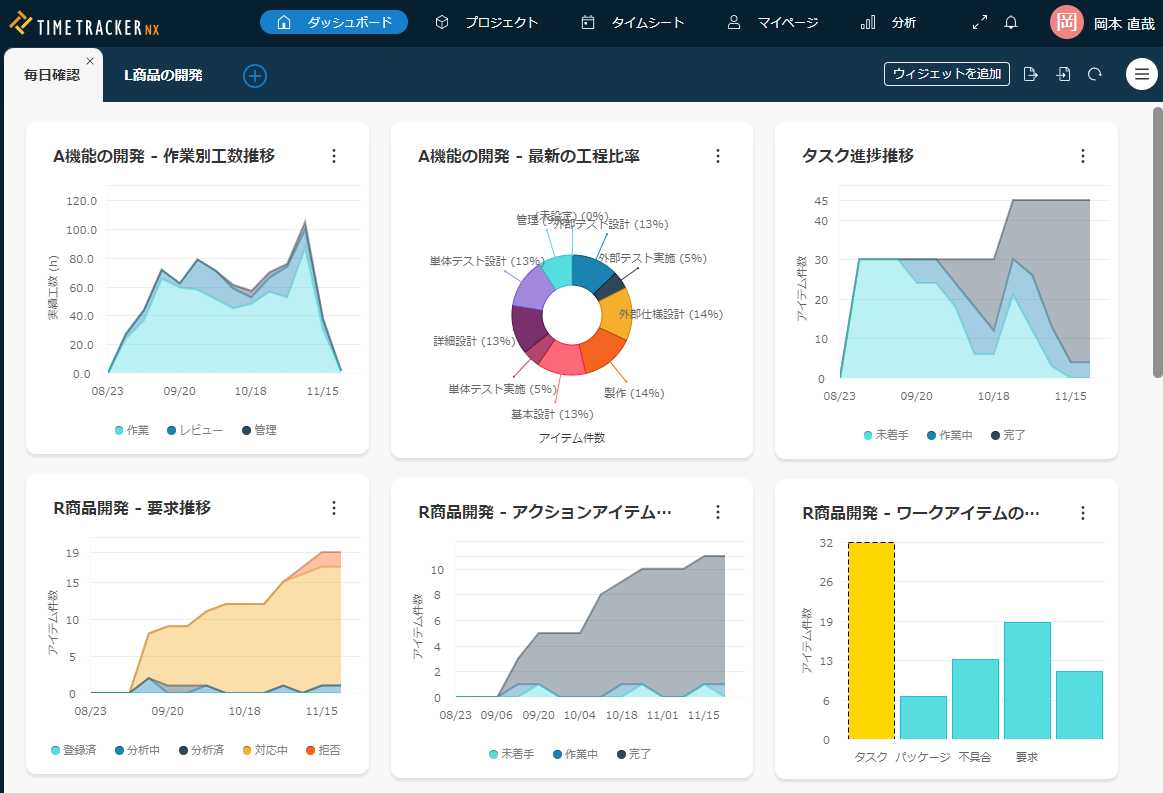
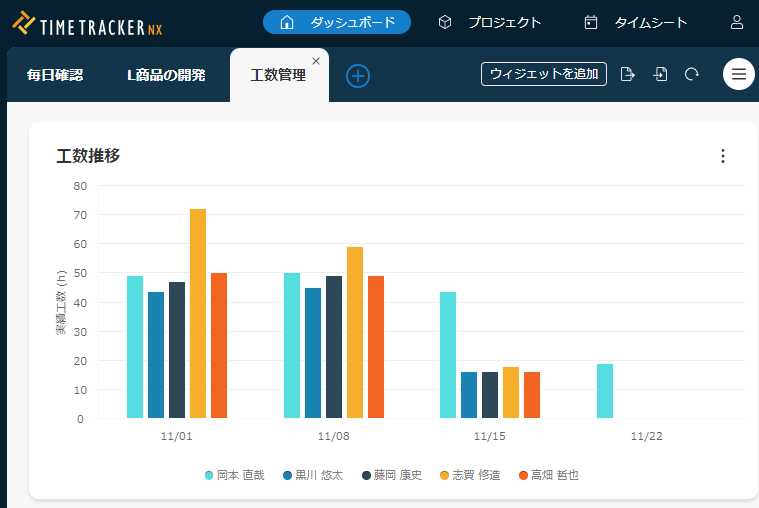
The man-hours and project-updates are checked in the dashboard that is displayed after the tool is started.
Since it's visible as soon as you log in to the tool, no separate check is required. -
Freely customized for each individual
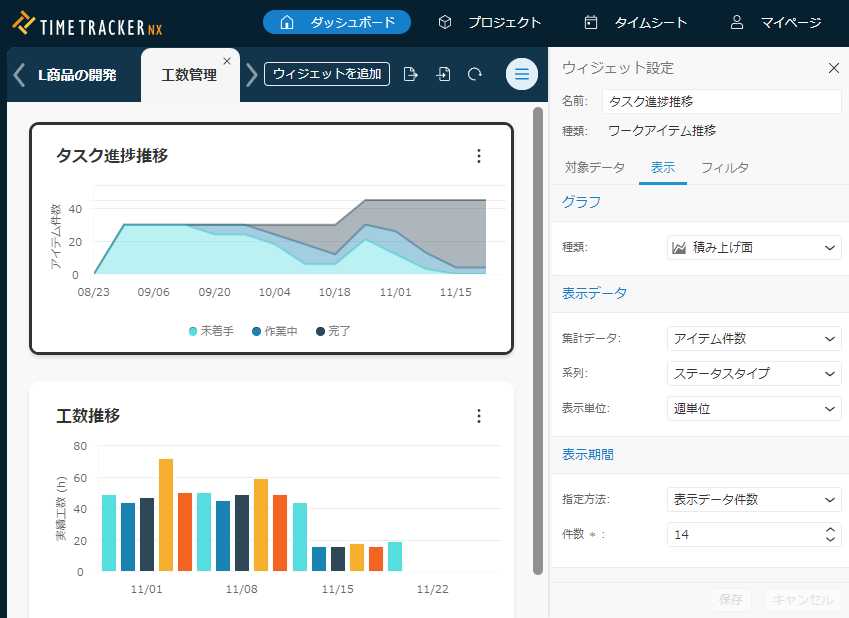
View can be customized freely for each member — for example, collecting only the items you need to check every day, or filtering the view to show just what's required.
A personal, easy-to-use screen means you won't miss the danger signals. -
Easy checking of members' daily loads
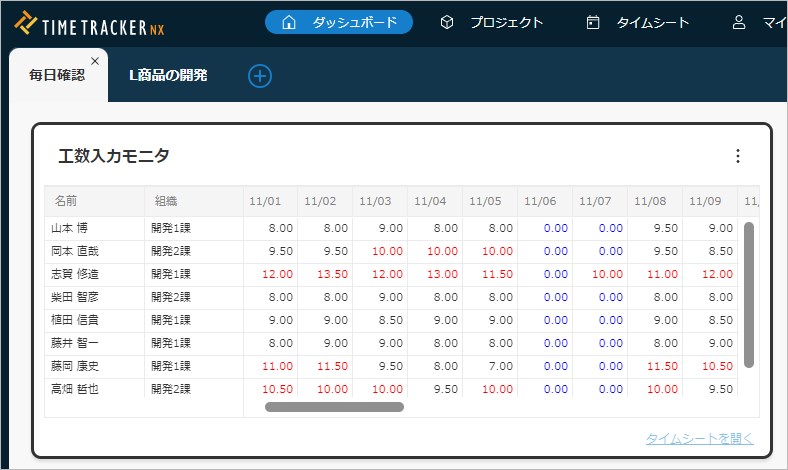
Knowing the daily effort of members is also important from the viewpoint of monitoring the status of overtime work and health management.
With Time entry monitor, you can easily keep track of your daily Actual time. It is also easy to detect high-load members. For example, a red View is displayed when the number of man-hours exceeds a certain level.
Function Details
"Proposals of Using by Issue" introduces functions that solve specific problems you may be facing — for example, if you want to visualize operational waste and improvement points using man-hours or easily check the status of multiple projects, take a look.
Please also refer to the list of TimeTracker RX functions.
Look at other features