


Analyzing easily with desktop application
BI function to enable high-speed
and large-scale calculation
BI Function
TimeTracker Analytics is a desktop application for analyzing all the effort, cost, and other data accumulated in TimeTracker RX. View in pivot tables with fast aggregation for your convenience.
focus on specific data using the filter function, or visualize it with graphical views. You can analyze the data however you like, leading to improvements.
By connecting to multiple databases, you can analyze data across departments and organizations.
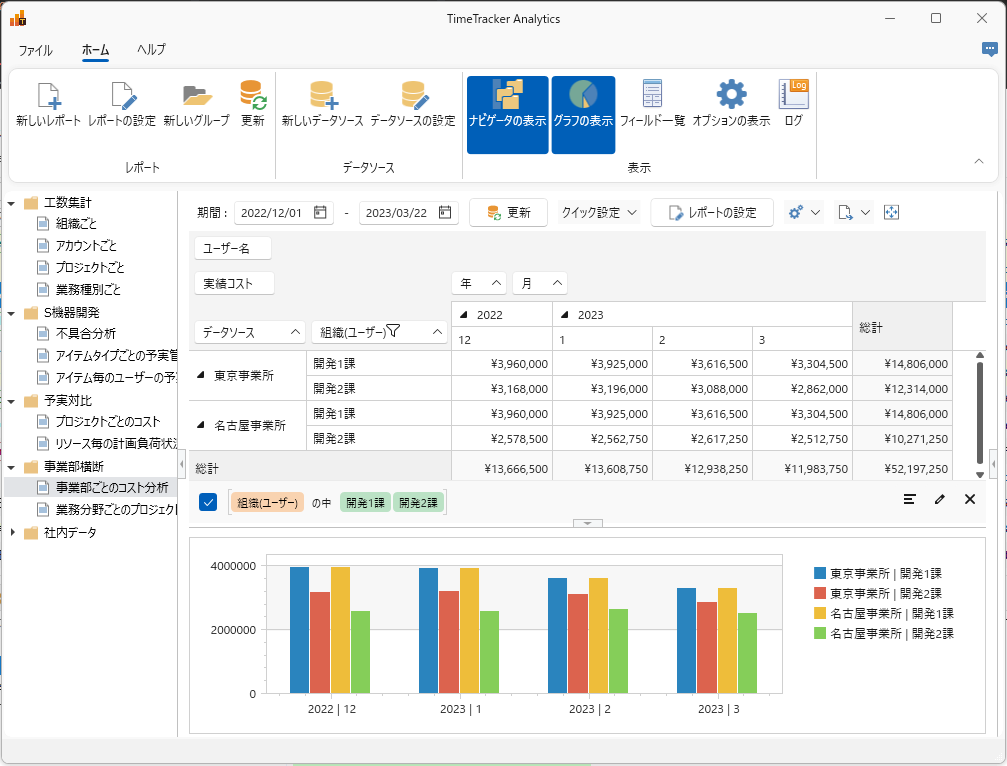
Enable to calculate data across organizations at high speed
The data accumulated in TimeTracker is collected at high speed for ease and ease of use only in desktop applications.
Data accumulated by departments and organizational units can be aggregated easily and quickly, leading to further analysis and improvement.
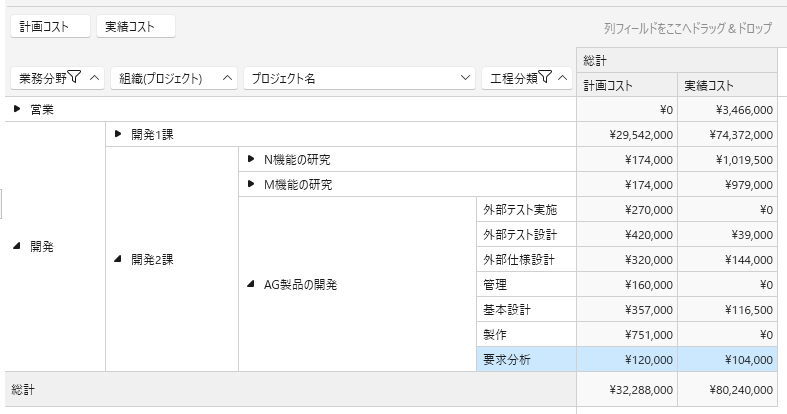
Diverse aggregation realized
It is not only the man-hours that can be aggregated.
As entered in TimeTracker, such as cost, Process category, or custom-field values
You can aggregate any data faster at the item level.
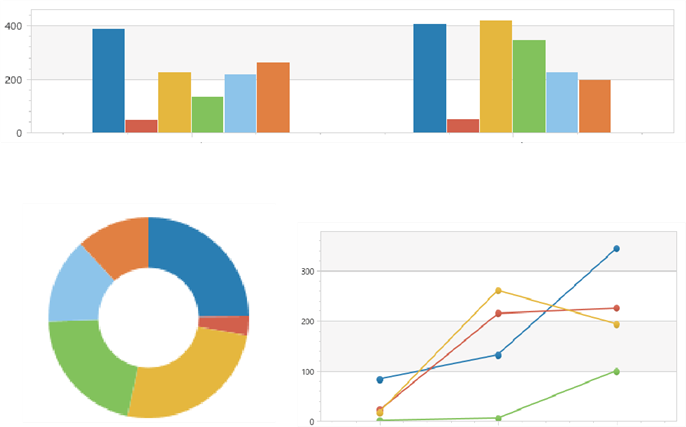
Understanding data visually
Aggregated data can be View as a graph with only simple manipulation.
There are also many types of charts, such as line and stacked bar.
By visually grasping the data, it is easy to compare it with the plan and to grasp processes with a lot of man-hours.
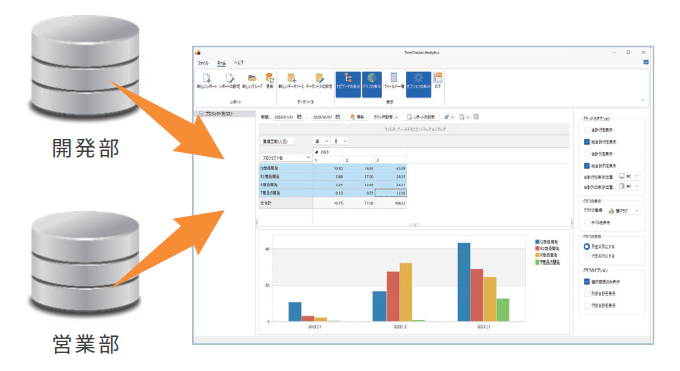
Join aggregates across DB
You can aggregate data across multiple databases.
By aggregating across separate TimeTracker arranged in departments and organizational units,
We will achieve greater visualization than ever before.
-
Graphing selected data immediately
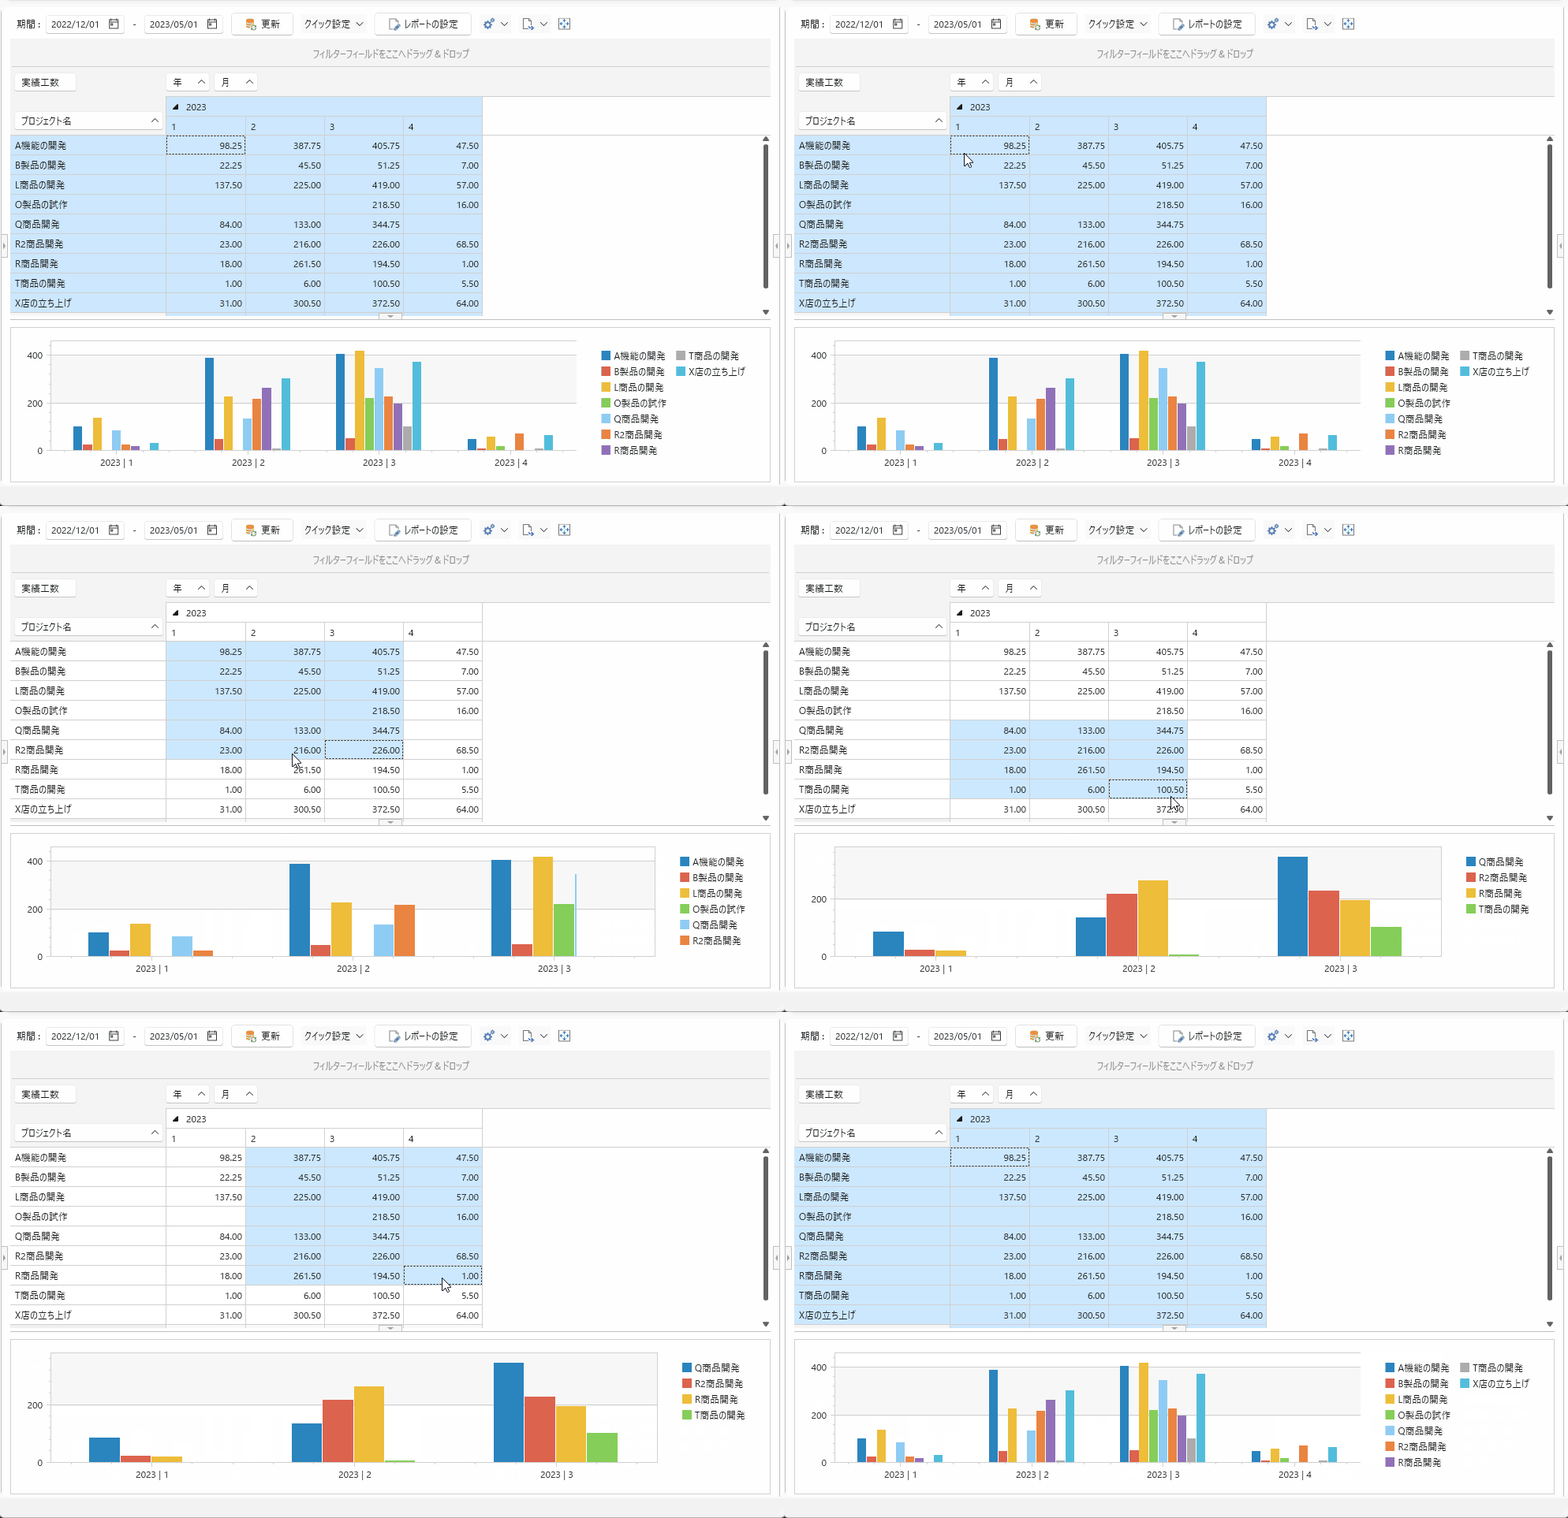
Simply select a table in the summary to dynamically View the chart for that part.
This is very useful if you want to graph data in this area only. -
Smooth sharing of results of analysis
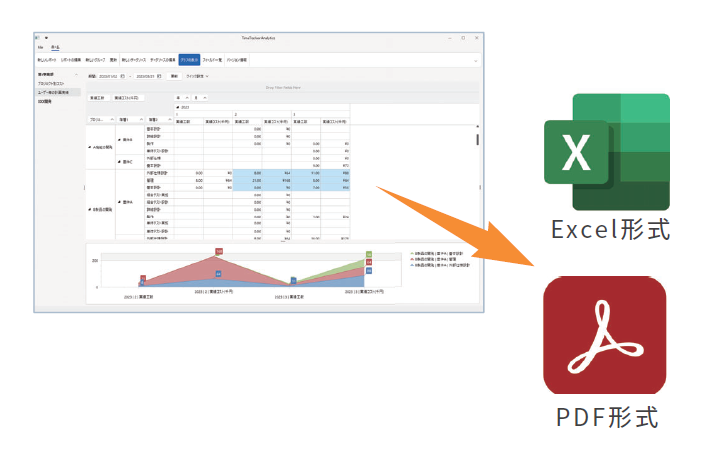
You can export the summary to a PDF or Excel format.
It can be used for a variety of purposes, such as sharing and expanding to parties who do not use the tool, and incorporating it into forms for everyday use.
Function Details
"Proposals of Using by Issue" introduces functions that solve specific problems you may be facing — for example, if you want to collect man-hour data without burdening the worksite or make time entry stick as a daily habit, take a look.
Please also refer to the list of TimeTracker RX functions.
Look at other features